Needle in a Haystack: Finding Missing Events on an Event Mesh

Event-driven architecture (EDA) and data-driven architecture (DDA) have been gaining popularity over the past decade, and they are increasingly being used in various areas as alternatives to request-driven architecture (RDA). The increasing popularity of EDA and DDA has led to the adoption of the event mesh as a key component to decouple systems and applications, but at the same time link them across multiple deployment locations (on-premises, private cloud, vendor network and public clouds).
Many organizations rely on an event mesh for dynamic routing of billions of event messages across different systems on a daily basis. However, one common challenge that arises is when event messages go missing occasionally, leading to disruptions in business systems.
Troubleshooting missing event messages is extremely difficult due to the sheer volume of events being produced. With billions of events flowing through the event mesh, it becomes a daunting task to identify and investigate one or two missing events. Compounding the issue is the fact that the event mesh does not log information at the individual event level due to performance concerns.
This article will delve into the technical reasons, considerations, and troubleshooting steps that can help identify where things go wrong in a distributed architecture.
Why do events get lost?
You may be wondering why event messages would be lost, especially since event brokers support at-least-once delivery guarantee. To be exact, most event brokers support both at-most-once (direct messaging) and at-least-once (guaranteed messaging) delivery semantics. The following discussions apply only to guaranteed messaging. A message has to be sent in “persistent” mode in guaranteed messaging.
It is important to understand that the event broker alone does not provide end-to-end event message delivery guarantee. The responsibility for guaranteeing the delivery of an event message from a publishing application to the event broker lies with both the broker and the publishing application itself. Even for event message consumption, the consuming application has to work with the broker to guarantee that an event message has been duly processed before it is removed from the broker.
This article will look at the entire end-to-end communication in-depth and attempt to explain the numerous ways an event or message could be considered “lost”, and how to find them.
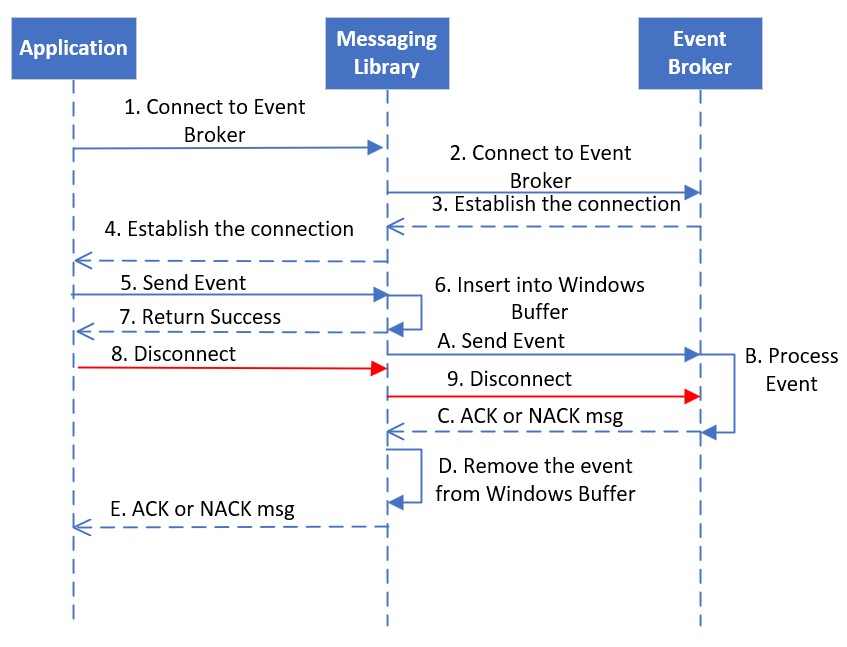
Publisher Responsibility with a Broker
As seen here, the communication between a publishing application (Publisher) and the event broker is established through a three-layer structure.
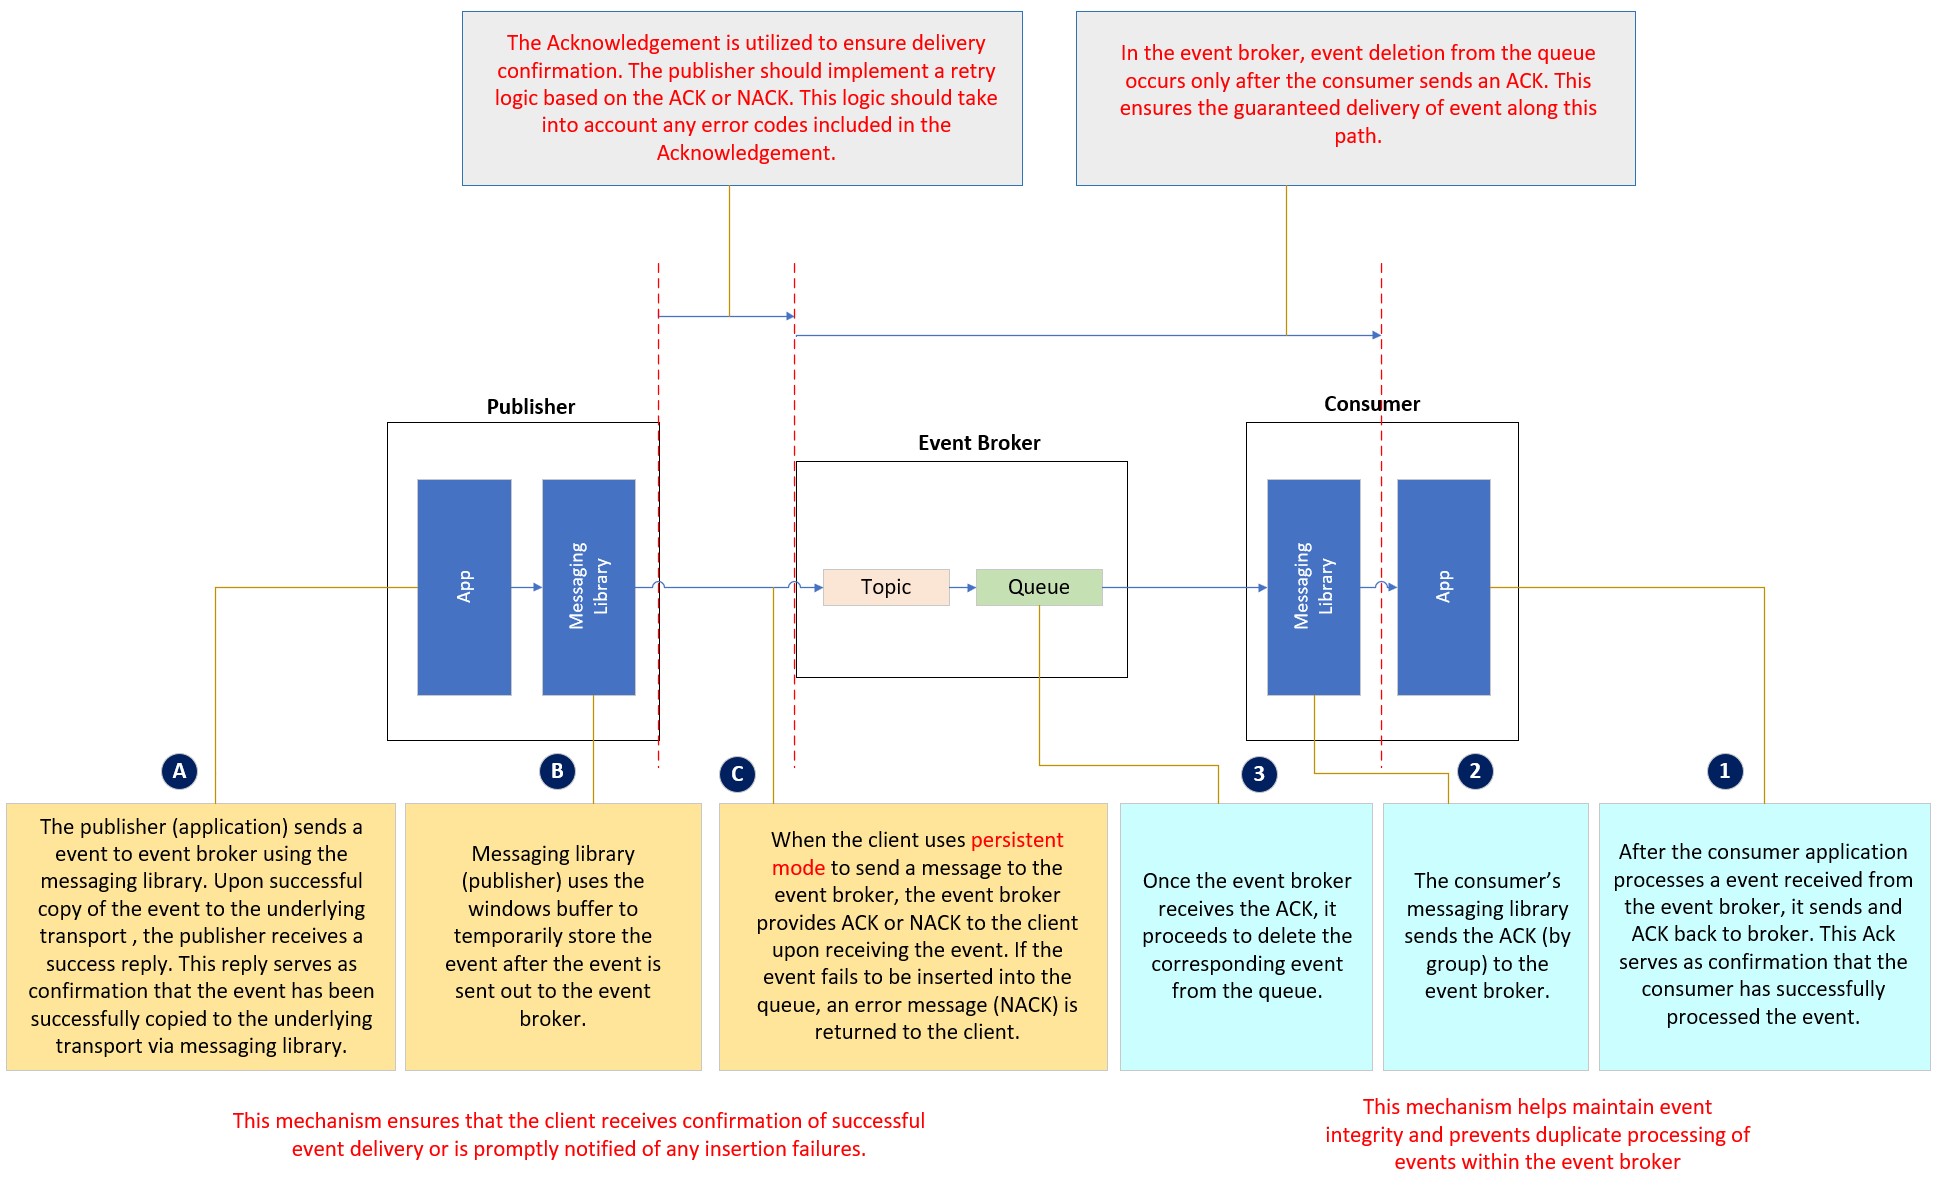
The application sends the event message to the event broker using a client messaging library, which is built on the top of TCP protocol. Both the client messaging library and the TCP layer have built-in retry logic, which relies on ACK (acknowledge), sometimes NACK (negative acknowledge) and time-out to attempt redeliveries.
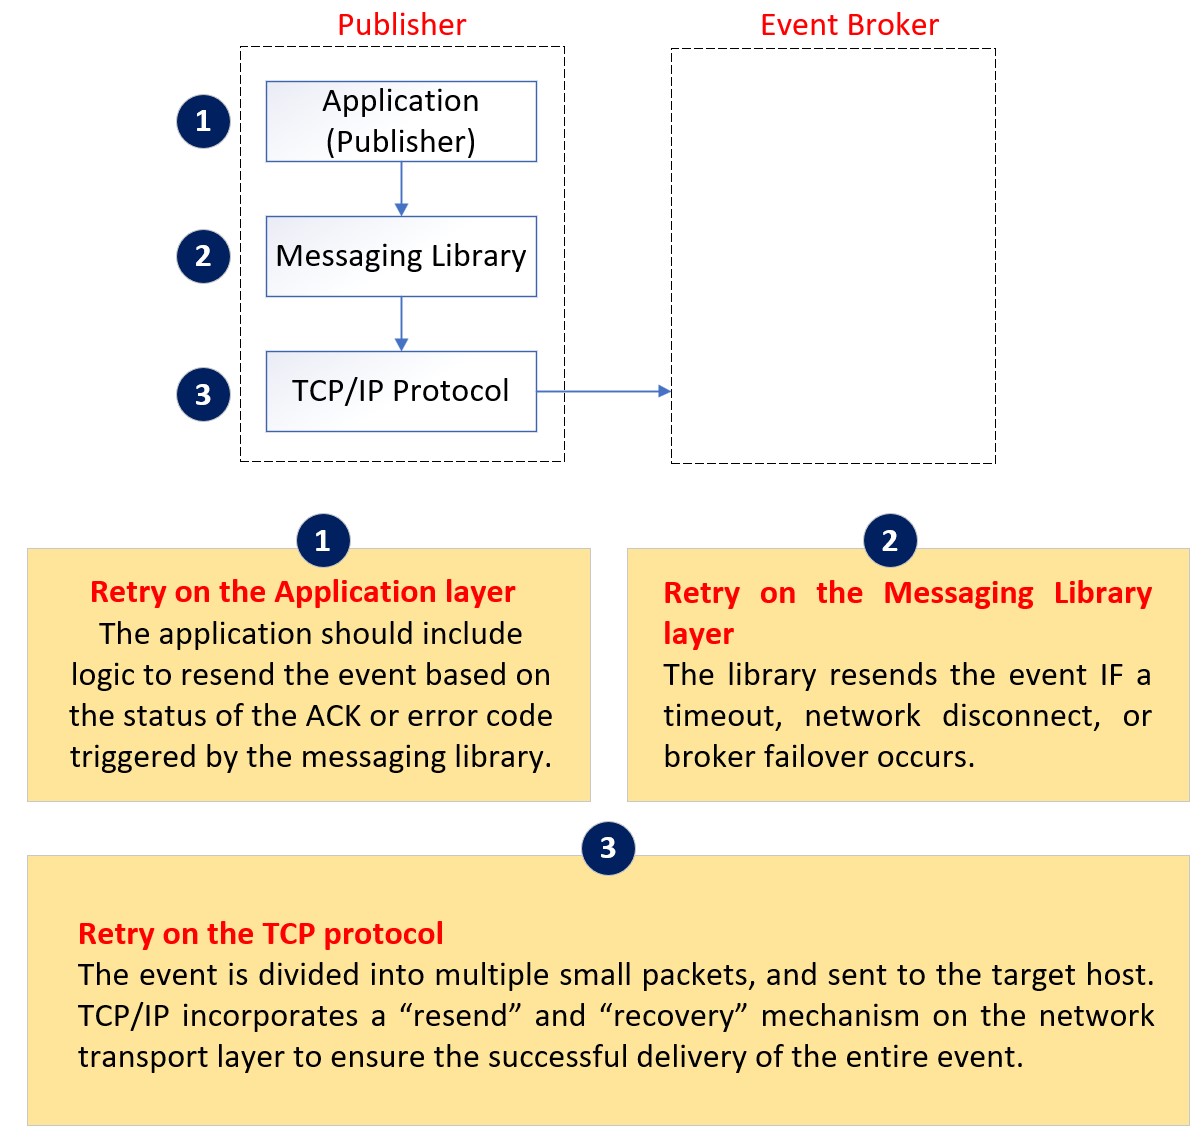
Retry on the TCP Layer
TCP, which means transmission control protocol, facilitates the reliable transmission of data between devices.
When sending an event over TCP, the event message is packaged into one or more network packets. The operating system then transmits these packets to the target device in order, utilizing a stateful connection with a sliding window. TCP uses retry mechanism based on the ACK packet and time-out to ensures that all packets are successfully transmitted and received by the target device, as well as network throttling and congestion avoidance. TCP provides a fair amount of reliability and benefits at the networking layer.
Retry on the Client Messaging Library Layer
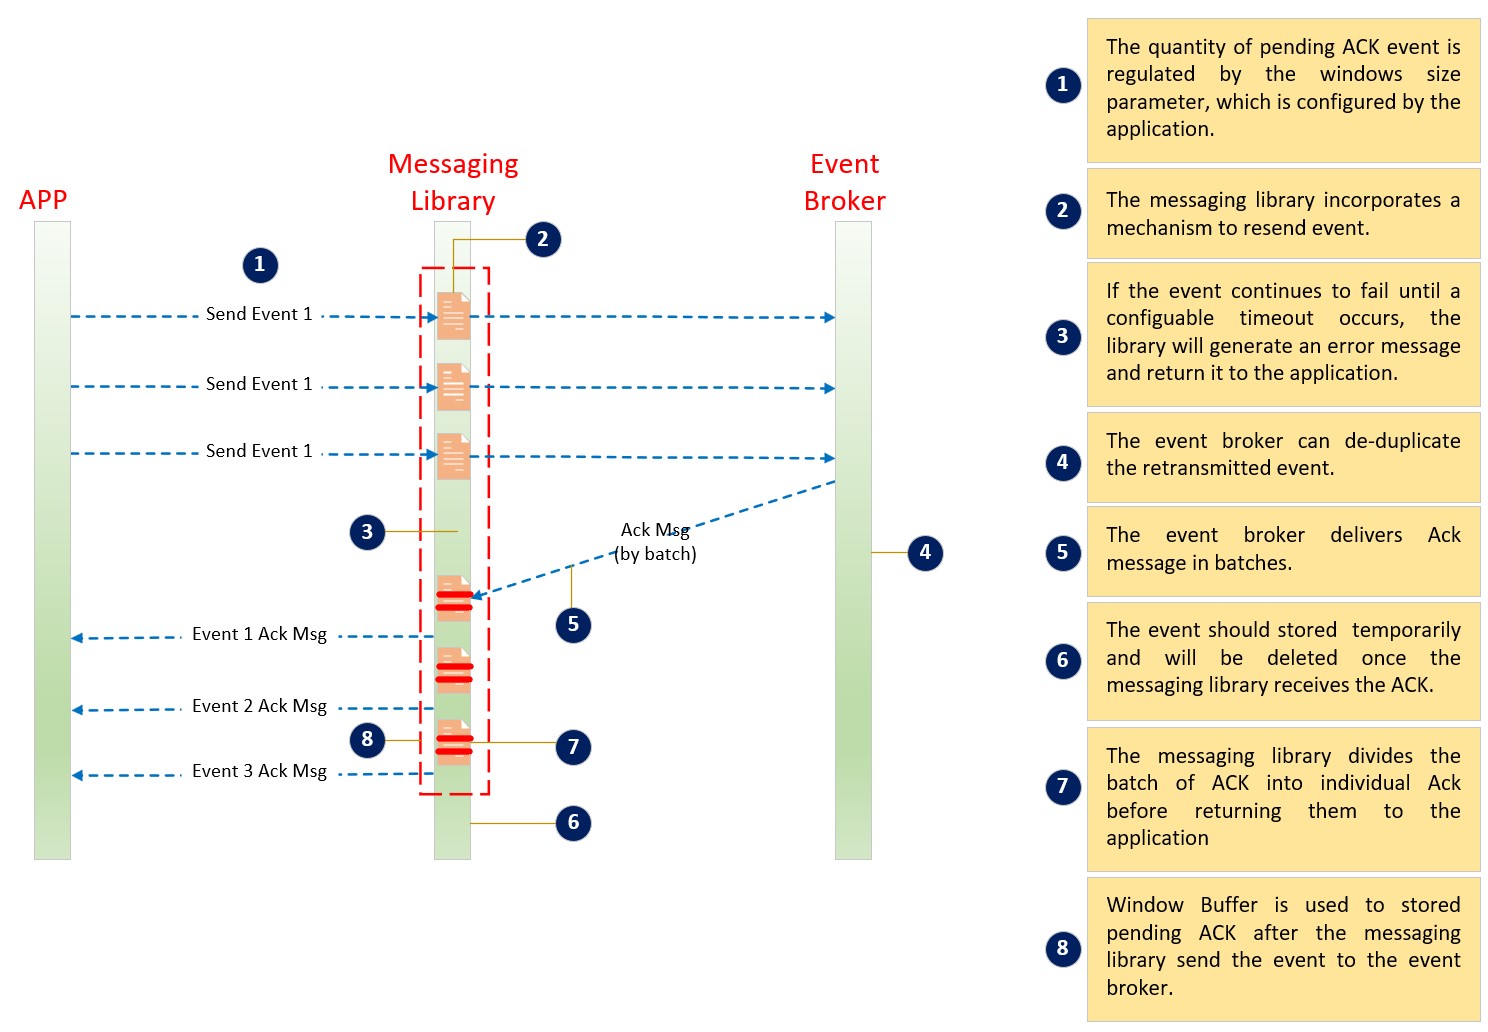
The client messaging library sends an event message to the event broker, and waits for the ACK or NACK from the event broker in asynchronous mode. The sent event is temporarily stored in a memory buffer until the client messaging library receives the ACK or NACK from the event broker (or network issues or time-out waiting for ACK/ NACK). The size of window buffer (windows size) is defined by the application, which determines the maximum number of event messages that can be pending for the ACK or NACK. The application can only send a new event when the window is open and there is free space available in the window buffer.
The client messaging library incorporates a mechanism to resend event message in the message of an ACK/ NACK is not received from the broker within a specified period of time (default 2 seconds), often caused by network connectivity issues. If a published event message is not acknowledged by the broker within this time, the library will attempt to resend it.
The event broker can de-duplicate the retransmitted event from the client messaging library by means of internal sequencing numbers on the persistent flow.
Retry on the Application Layer
If the application sends event messages in persistent delivery mode, it is essential for the application to receive an ACK or NACK for every event it sends to the event broker through the client messaging library. The ACK or NACK informs the application whether the event has been successfully received or rejected by the event broker. Rejection might be due to situations like resource limit reached (e.g. queue full), publish ACL violation, or capability mismatch. The application should be programmed to handle these NACK replies, and make the decision to resend or not. NOTE: the API will not automatically resend a NACKed message during due to these failure reasons; only due to network issues or broker failovers. The following diagram shows the possible configuration which causes event loss.
Reason for the NACK reply
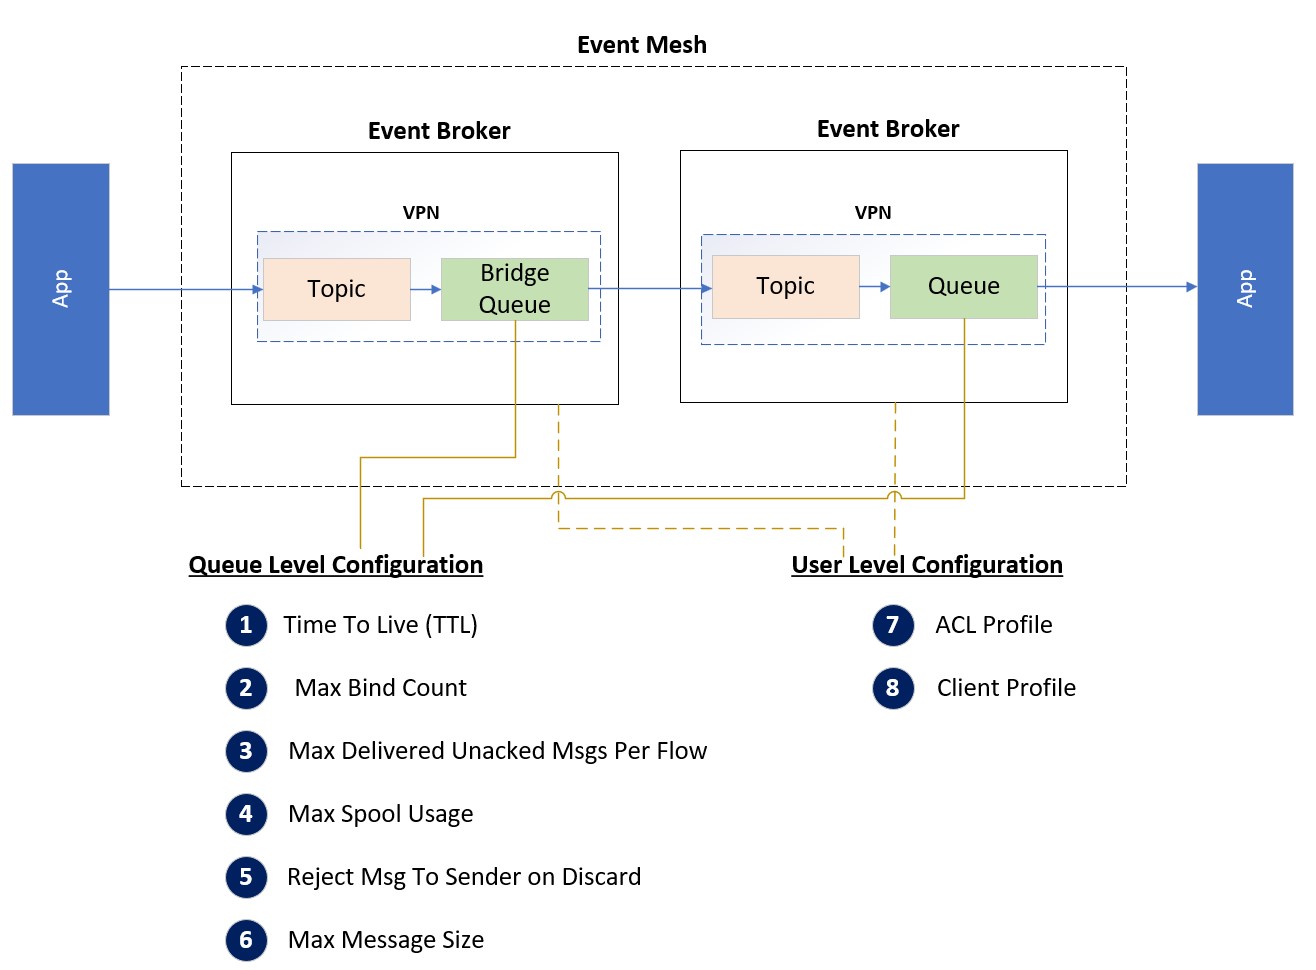
| Item | Configuration | Definition | Common Mistake |
| 1 | Time To Live (TTL) | The duration that limits a message’s lifespan within a queue. This value can be set eighter at the message level by the application or at the queue level by a program or administrator | The maximum spool usage exceeds the allocated space values at both the VPN level and the broker level. The values assigned at the VPN and broker levels are significantly smaller than the cumulative maximum spool usage of all queues |
| 2 | Max Bind Count | The maximum con-current connection per queue or per account (Client Profile). | Sharing the same account across multiple clients. |
| 3 | Max Delivered Unacked Msgs Per Flow | The maximum unknowledge message of each individual flow on the consumer side. | The application forgets to ack message API call when they use the manual Acknowledge function |
| 4 | Max Spool Usage | The maximum messages on the queue and VPN. | The value of VPN level and broker level space value is much less than the sum of all queues’ maximum spool usage. |
| 5 | Reject Msg To Sender on Discard | If this value is set to true, the Publisher will not receive a negative ack message even if the connection is set to persistent delivery. | |
| 6 | Max Message Size | The maximum message size of each individual message. It can be configured at either the queue level or VPN level. The comment mistake is the value of VPN level is less than the value on the queue level | The value set for the VPN level is smaller than the value set for the queue level. |
| 7 | ACL profile | The configuration that controls the access permissions for publishing or subscribing to message from specific topics. | The conflicts between different rules within the same ACL Profile or Client Profile |
| 8 | Client Profile | The configuration that controls the access permissions for publishing or subscribing to message from specific topics. |
From the application’s perspective, an event message can be sent synchronously or asynchronously. When sending events asynchronously, the application must implement retry logic based on the NACK response from the messaging library layer which is delivered to the publish event handler via a separate thread. Applications sending event messages synchronously, on the other hand, will block waiting for the send result, either returning if successful, or throwing an exception. While synchronous send is simpler to implement retry logic than asynchronous send, its performance can be drastically slower. When JMS 1.1 API is used, however, only blocking synchronous send is supported for persistent messaging.
In either case of asynchronous (streaming) or synchronous (blocking) publishing, the applicaction needs to verify the success of the publish operation; and if it fails, the application must decide what to do with it: republish, do nothing (i.e. “lose” the message), log-and-continue, publish to a different “error” topic, etc.
Event Broker Failover or Network Disconnect
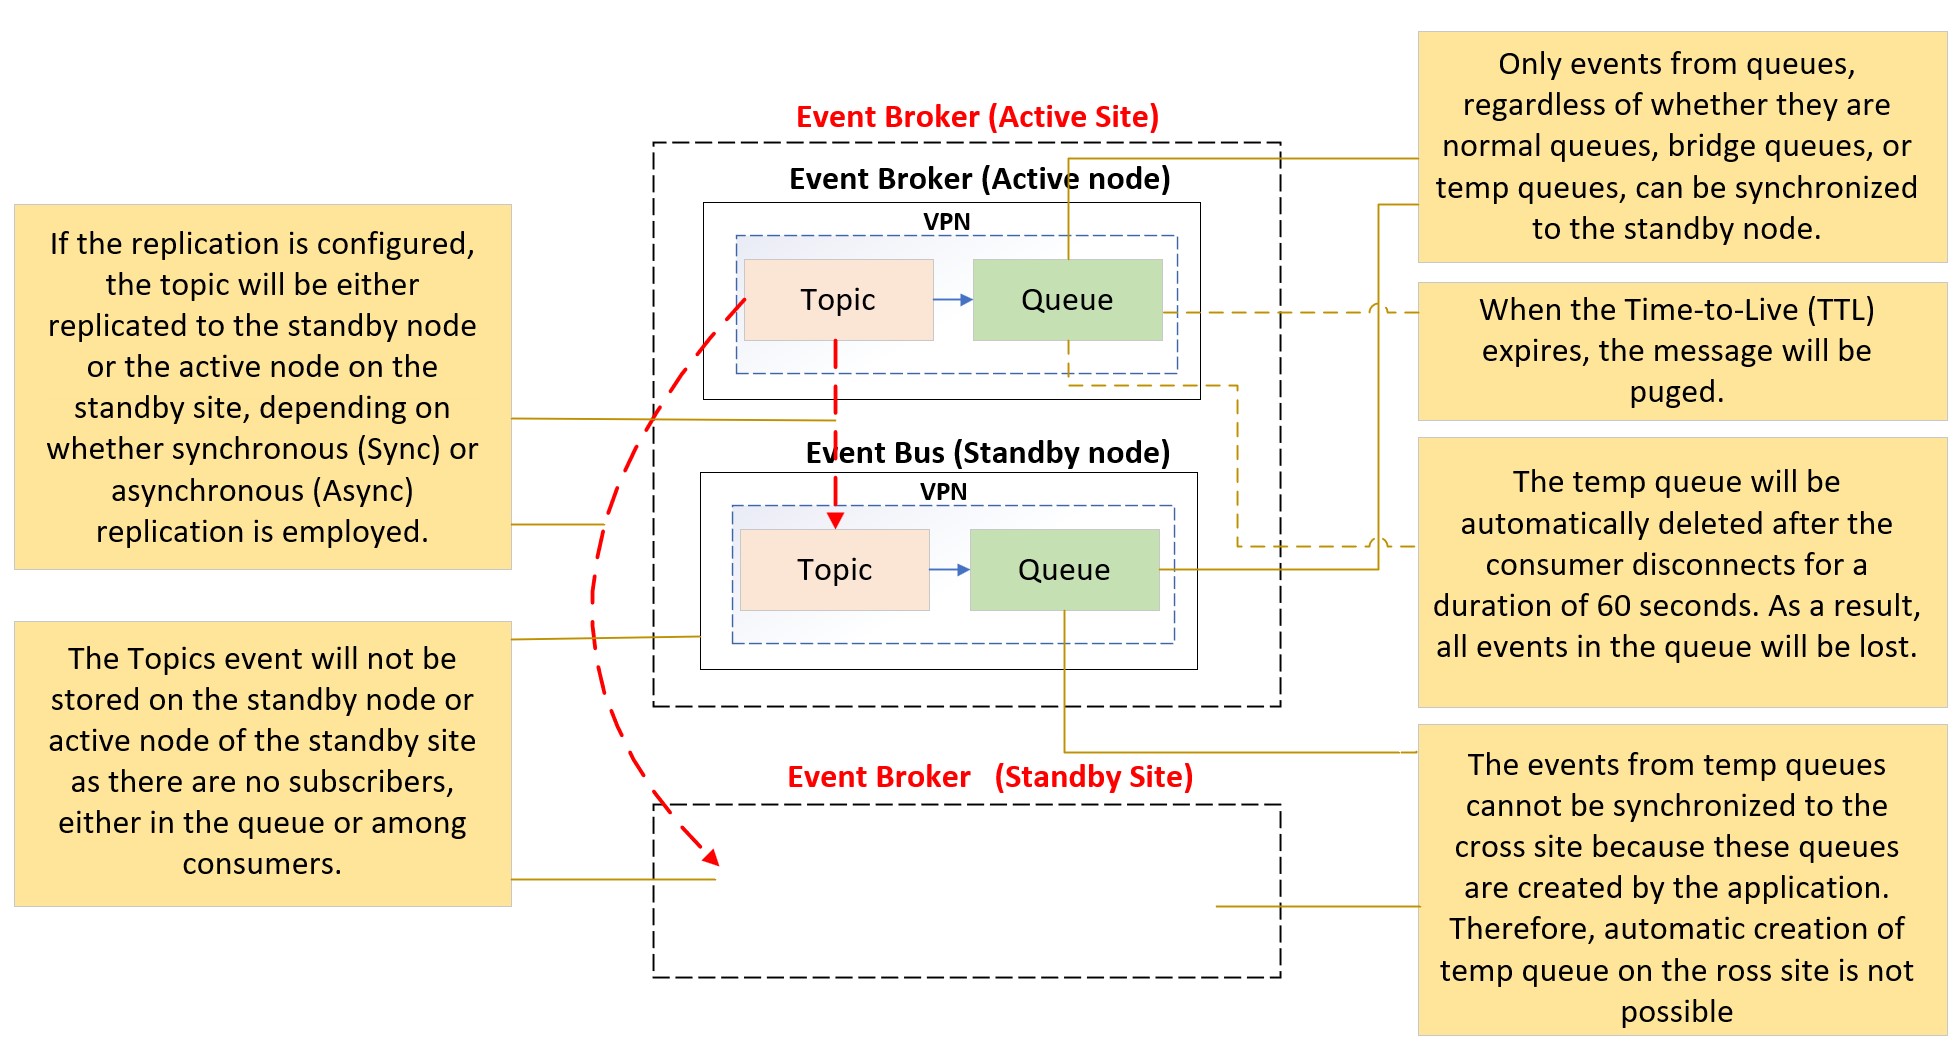
Even if the sending application has done everything right according to the above discussion, there is still a very small chance of events missing due to other factors such as event broker high availability (HA) or disaster recovery (DR) failover if the correct broker settings are NOT being applied. Network connectivity also impacts event message delivery across the event mesh through dynamic message routing (DMR) or VPN Bridge. Therefore, it is crucial to carefully configure the event broker, and perform failover and DR testing. For instance, if the is subscribing application is using direct topic subscriptions (non-persistent), all event messages in-flight to that subscriber will be lost during event broker HA or DR failover. The table below provides a summary of various scenarios for the direct and persistent event message:
| Network Disconnect | HA Failover | DR Failover | |
| Direct Event Message | Event message lost | Event message lost | Event message lost |
| Persistent Event Message | Event message lost after TTL or redelivery retry count exceeded the configured max | No impact | No impact if the replication is sync |
| Temp Queue | Temp queue will be deleted if the client is disconnected after 60 seconds, and all events will be lost | No impact | Event message lost |
| Persistent message across DMR/VPN Bridge | Event message lost after TTL expired | No impact | No impact |
| Direct message across DMR/VPN Bridge via topic | Event message lost | Event message lost | Event message lost |
Subscriber Responsibility with a Broker
Similarly to publisher applications, Guaranteed subscribing applications also have certain responsibilities to ensure messages do not get “lost”. Using persistent messaging, the event broker does “at-least-once” delivery to the subscriber application via the API. It is the application’s responsibility ACK each message once it has finished processing it (e.g. stored it to disk, committed to a database, onward published and received confirmation, etc.) which will cause the broker to remove the message from its persistent storage. Subscriber applications should not use the “auto ACK” feature, as this can cause message loss in failure scenarios; subscribers should only acknowledge once the received message is processed and safe.
Note that sending subscriber ACKs to the broker is asynchronous, and are flushed periodically (at least once a second), and hence there is a chance for duplicate messages if the subscriber application terminates or crashes immediately after ACKing a message, but that ACK has not yet made it to the broker, and the broker will redeliver.
There is almost always a chance for redelivery or duplicate messages in the instance where
How to Find Missing Events
Missing events can have a significant impact on the business, so it is crucial to quickly identify the possible problem areas and restore the system as soon as possible. This may involve actions such as resending the event or manually patching the data, rather than spending too much time troubleshooting the root cause. It is essential to prioritize system recovery to minimize impact on the business operation.
Once the system is resumed, it becomes the highest priority to investigate and determine the root cause of the incident. This is done to prevent the same issue from occurring again in the future.
However, it is important to note that troubleshooting missing event messages can be time-consuming and complicated. It often requires collaboration across multiple parties, including the application and infrastructure teams. Effective communication and cooperation among these teams are crucial to resolving the issue efficiently.
To streamline this process and expedite troubleshooting, you need to collect all necessary information (Publisher and Subscriber server and client name, corresponding Topic and Queue name and all involved event brokers) before proceeding with hunting down the missing event step by step.
The following troubleshooting procedure can be utilized to effectively resolve the vast majority of cases, in my experience.
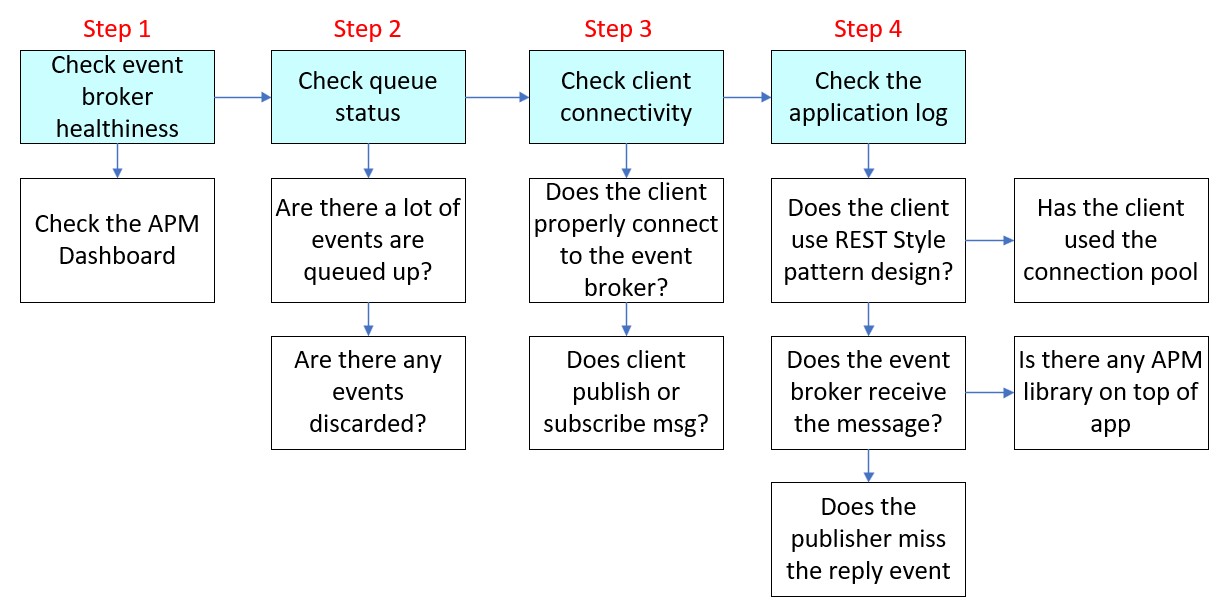
1: Check Event Broker Health
The first step in troubleshooting is to ensure the health of the event broker, because an unstable environment can cause various unforeseen behaviors. Most organizations implement an Application Performance Management (APM) dashboard to monitor and display event broker component status based on event log analysis using Splunk, DataDog, AppD or Dynatrace. This includes monitoring event broker hardware status, network connectivity status, and other relevant metrics.

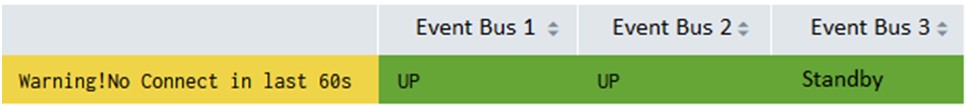
In addition, you have the option to schedule a job for collecting event broker statistics using the Solace Element Management Protocol (SEMP) at predefined intervals and sending this information to the APM backend. This enables the APM dashboard to provide more detailed information about when or near the time an incident occurred, thereby expediting the troubleshooting process. For example, the APM dashboard can shows the last 60 seconds status update of the event broker, including notifications of unexcepted HA failover.
2: Check Event Broker Admin Console
Once you have confirmed that the event broker is running normally, you can proceed to log in to the event broker admin console (assume using SolAdmin). From there, you will be able to access and view all configurations at event broker level, VPN level, or queue level.
![]()
The Endpoints tab in the admin console provides a list of queues with their current usage, grouped by VPN name. This information includes metrics such as the total bind count and spooled message size. If the number of Messages Spooled is greater than 0, it indicates that there are pending event messages in the queue waiting for consumers to consume.
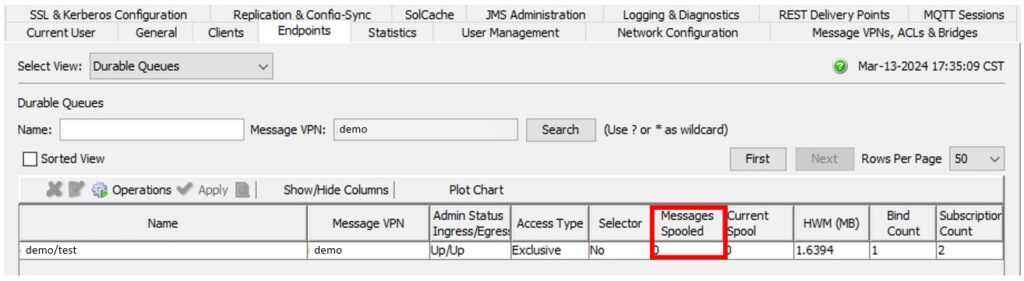
After selecting a specific queue name, you can right-click to open the queue properties window. This window provides two sections of information: queue statistic and queue properties.
The “queue statistic” section presents the number of event messages discarded or deleted, categorized by different reasons. This information can be helpful in identifying possible causes of the issue. On the other hand, the “queue properties” section displays the configuration values for each parameter related to the queue. This provides a comprehensive view of the queue’s setting.
In most cases, it is relatively easy to identify the possible root cause by analysing the information and cross-referencing the actual time of events from the event broker event log to gain further insights.
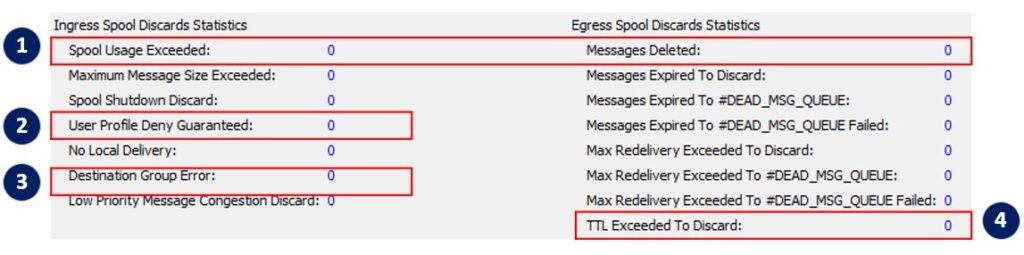
| Item | Behavior | Event Log |
| 1 | The number of NACKed back to the publisher | VPN_AD_MSG_SPOOL_QUOTA_EXCEED: ….. [queue name] message spool quota (12288000 kB) exceeded, messages discarded |
| 2 | The event is rejected due to the event size being over the “Large Message Size” parameter setting on the queue or VPN level. | CLIENT_CLIENT_LARGE_MESSAGE: ….. Large Message threshold (1048576 bytes) exceeded: 1354861, topic [Topic Name] |
| 3 | The event is rejected due to the Client profile publish/subscription rule | SYSTEM_CLIENT_ACL_PUBLISH_DENIAL: – – 2 publish denials were recorded in the last minute due to ACL profile configuration |
| 4 | The event is deleted due to TTL | N/A |
3: Check Connectivity
Most connectivity issues stem from authentication problems following an application’s major update, and there are not any events can be sent out. You can easily pinpoint the root cause by examining the event log in the event broker. This session will illustrate the potential root cause with two examples: Kerberos authentication through SMF on the server side, and OAuth authentication via MQTT on the client side.
Kerberos authentication through SMF on the server side.
Kerberos is a widely-used authentication method within data centres because it works with all domain-joined servers, whether they run Windows or Linux. To set it up, we export the keytab file from the Active Directory server and import it into the event broker. When a client tries to connect, it obtains a ticket from the LDAP server using a service account, which it then presents to the event broker. The event broker uses the keytab to validate this ticket. Problems can arise from incorrect setting on either the application host or the event broker. The diagram below highlights some typical issues.
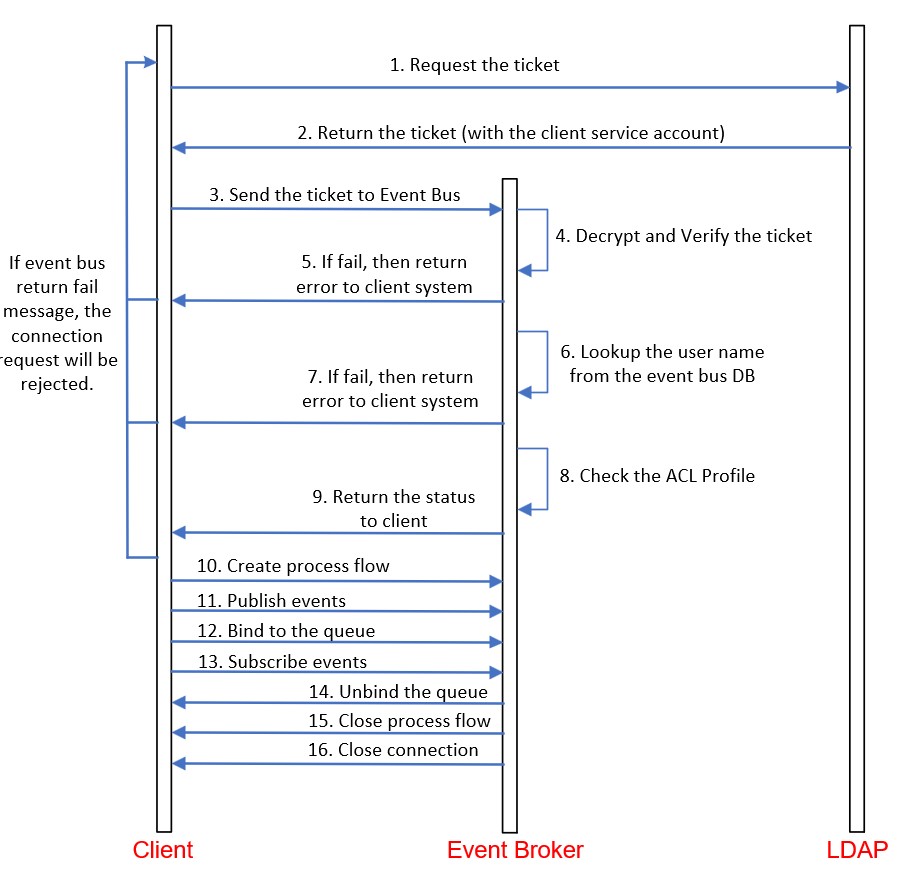
| Step | Behaviors | Root Cause |
| 4 | Find the following error from the Event Log
Jan 1 01:00:00 …..: VPN: VPN_CLIENT_USERNAME_CONNECT_FAIL: ….. – Client Username Is Shutdown |
This error is encountered while attempting to retrieve the client’s name from the event broker. This issue is most likely caused by a case mismatch between the client’s name on the LDAP and the event broker. |
| 5 | Find the following error from the Event Log
libcrypto-1_1.dll’, error: The specified module could not be found. |
There is an incompatibility issue between the MS C++ Redistributables and the event broker client SDK. The client needs to reinstall the necessary components. |
| 5 | When run “klist get solace/[hostname]”, return error ‘invalid encrytion type’ | Does not enabled Local Security Policy for the RC4_HMAC_MD5 encryption type. Most likely this case happen after machine hardening |
| 5 | Find the following error from the Event Log
Client Certificate Authentication is not supported on unsecured sessions |
The connection URL is using ‘tcp’ instead of ‘tcps’. |
| 5 | Find the following error from the Event Log
Init solace session error:Failed to connect session ….. IAM.Compliance.Queues.QueueClientSolace. .ctor(SolaceSessionConfig config) Or Jan 1 01:00:00 [event bus name] event: SYSTEM: SYSTEM_CLIENT_CONNECT_FAIL: – – ….. not found in keytab (ticket kvno 3) (0xd0000, 0x96c73a23) |
The username defined in the Domain may differ from the one defined in the event bus, such as variations in uppercase and lowercase letters. |
| 5 | Find the following error from the Event Log
Operation Error: ReturnCode = SOLCLIENT_FAIL Error ….. Error string=InitializeSecurityContext: failed on session ‘(c0,s1)_intg’ rc= SEC_E_TARGET_UNKNOWN’., Response code= 0 ) …..OperationErrorException: Failed to connect session |
The connection string is incorrect, or the application encryption type is not properly configured and available on the event broker. |
OAuth authentication via MQTT on the client side.
MQTT stands out for giving detailed error codes that clarify why a connection was refused, making it simple to trace the issue’s origin. Under the OAuth 2.0 framework, the event broker periodically syncs with the CIAM to obtain a public key, which is then used to authenticate the JWT for each connection attempt. There are many potential causes for connection rejections, but the most common ones include:
- Rejection due to expired JWT
Clients must update their JWT before it expires to maintain their connection with the event broker. The event broker keeps track of the token’s expiration and will automatically sever connections when that time comes. Occasionally, an application cannot update its JWT in time due to ongoing transactions, leading to missed events when the event broker disconnects the session. - Rejection due to invalid connection.
After the client utilizes the refreshed JWT to re-establish a connection with the event broker, it inadvertently continues to use the prior connection to transmit events. Consequently, the event broker identifies and rejects this invalidated connection. - Rejection due to an excessive number of concurrent connections.
The client establishes a distinct connection on each page without terminating the previous one. Consequently, if the cumulative number of concurrent connections surpasses the event broker’s maximum allowed concurrency for each client, the event broker will refuse the new connection.
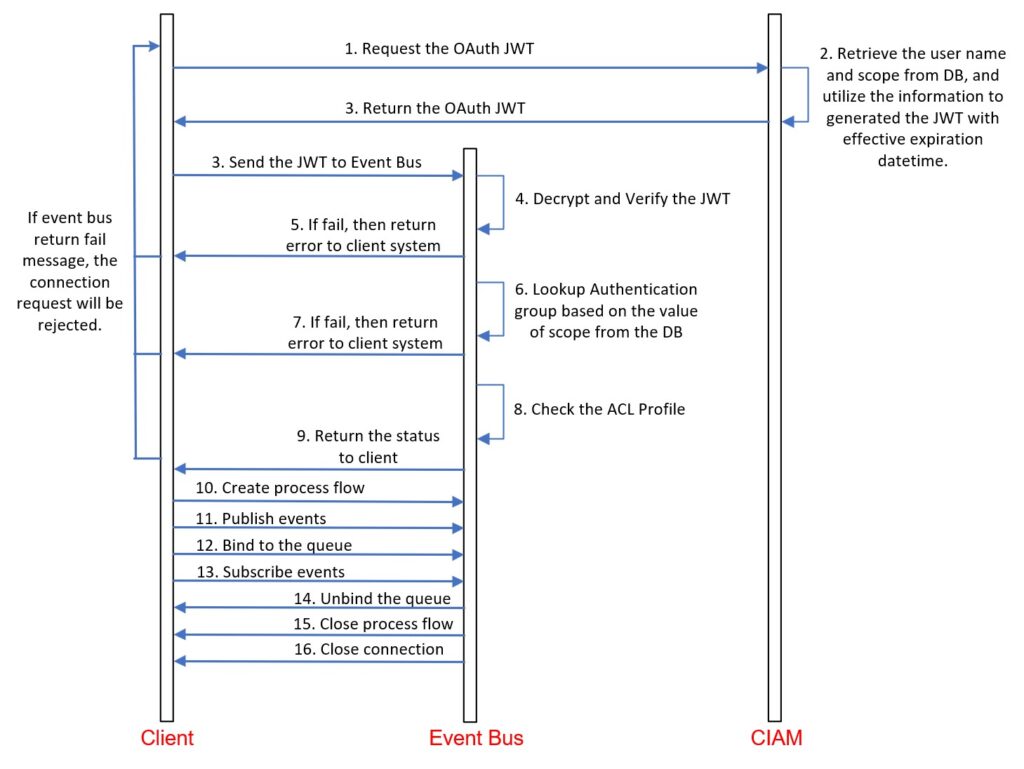
| Step | Behaviors | Root Cause |
| 5 | Find the following error from the Event Log
Jan 01 01:00:00 [event bus name] ….. using scheme OAuth – Unauthorized: Token Has Expired |
The client is attempting to connect to the event bus using an expired JWT (JSON Web Token). |
| 5 | Find the following error from the Event Log
Jan 01 01:00:00 [event bus name] ….. username [user name] Parse Error |
The client is utilizing an invalidated connection to publish the event. It is highly probable that the application is publishing events using a previous connection. |
| 5 | Find the following error from the Event Log
Jan 01 01:00:00 ….. – Service Unavailable: Too Many Connections For Client-Username |
The individual client is establishing an excessive number of concurrent connections, exceeding the configuration specified in the client profile. This is most likely an application bug because one client just needs to establish one MQTT connection. |
4: Check Application
If you cannot find the issue from the previous three steps, consider yourself lucky because you are about to embark on a magical and wonderful journey. This journey will be a challenging and will require more than ten hours of work under pressure.
It’s challenging because you need to analyse thousands of lines from the application debug log to find the pattern, and there is no unique key between the application log and client messaging library log.
The event message loss can be due to various reasons related to the application logic, architecture design, or product behaviour. In most cases, we can only trace and identify the root cause when the publisher enables persistent delivery mode and debug level logging. Let’s see some common errors below:
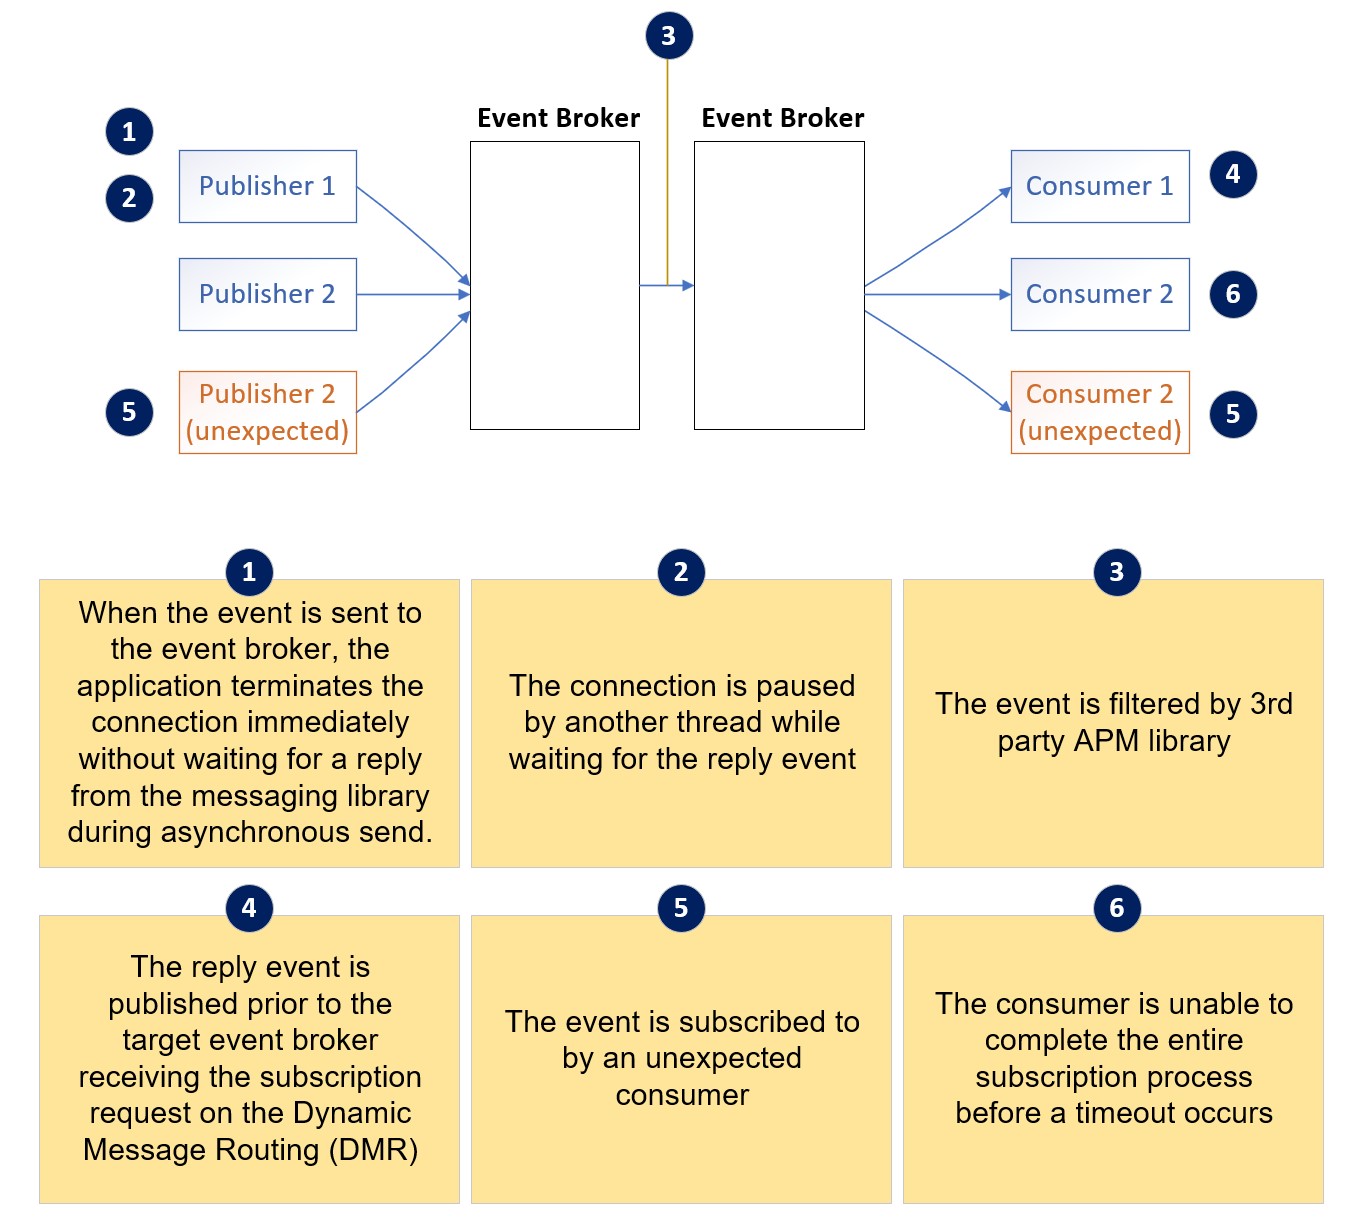
Terminated Connection
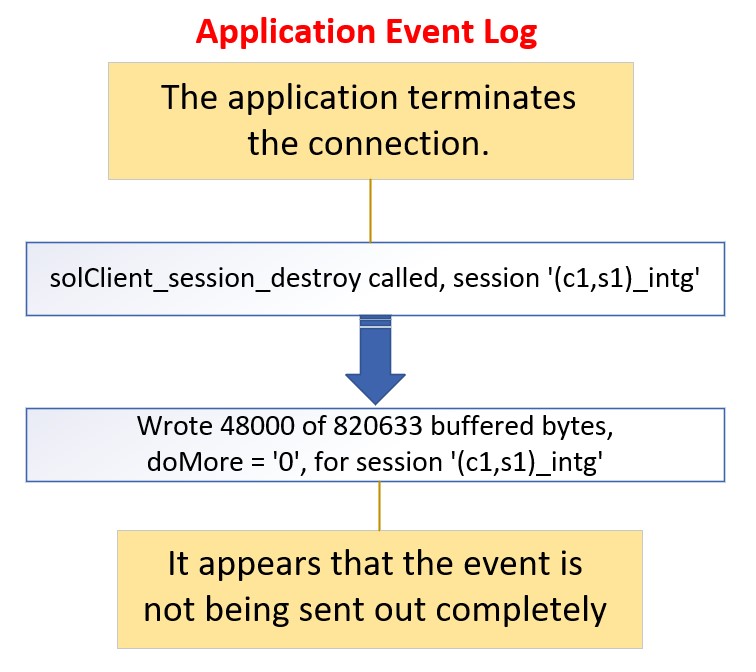
When the event is sent to the event broker, the application terminates the connection.
This issue always occurs with REST-style access, where the publisher establishes a new thread to handle each client request, and sends it to the source system for further processing. Each thread creates a separate event broker session flow connection and closes it after receiving a successful return from the client messaging library. However, the successful return only indicates that the event has been sent to the transport layer (the TCP send queue). It still takes time for operating system to send the packets to the event broker. If the connection is closed by the application immediately after return from the send() function call, the message might have been lost. Missing events frequently occur when the event message size exceeds 0.5KB.
| Step | Behaviors | Root Cause |
| 8,9 | Find the following error from the Event Log
You will find the following log message
|
The application terminates the connection (step 8, 9) before messaging library fully sends the event to the event broker (step A). So the event bus cannot receive this event. |
There are two ways to solve this issue:
- Short-term solution: Enable persistent delivery mode, and close the connection only after receiving the ACK or NACK message from the event broker.
- Long-term solution: Implement a connection session pool, ensuring that all threads utilize the persistent connection from the connection pool.
It is important to note that creating and closing connections for each request is a very expensive operation which can significantly impact the performance, making it slower than traditional REST calls. Therefore, an Event-Driven Architecture design does not recommend REST-style access.
Follow these steps to troubleshoot this type of issue:
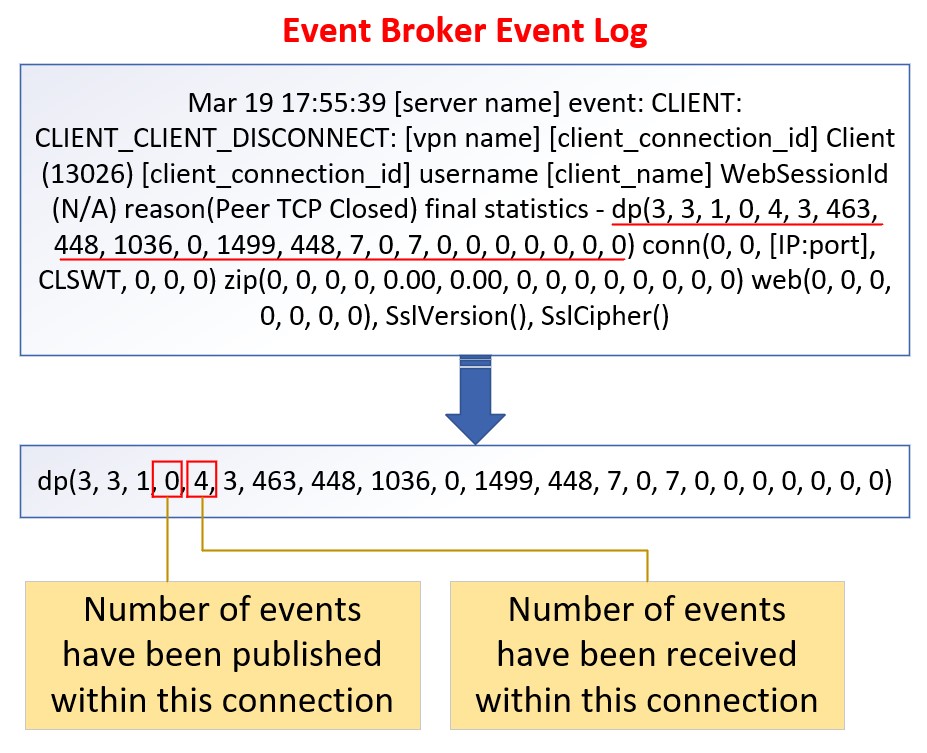
- On the event broker event log, verify if the connection close event (on the third field of dp(,,,,,)) is not publishing any event message from the disconnected event.
On the application log, look for event message “…Wrote …. Of …. Buffered bytes”” after the line of event “solClient_session_destroy called”.
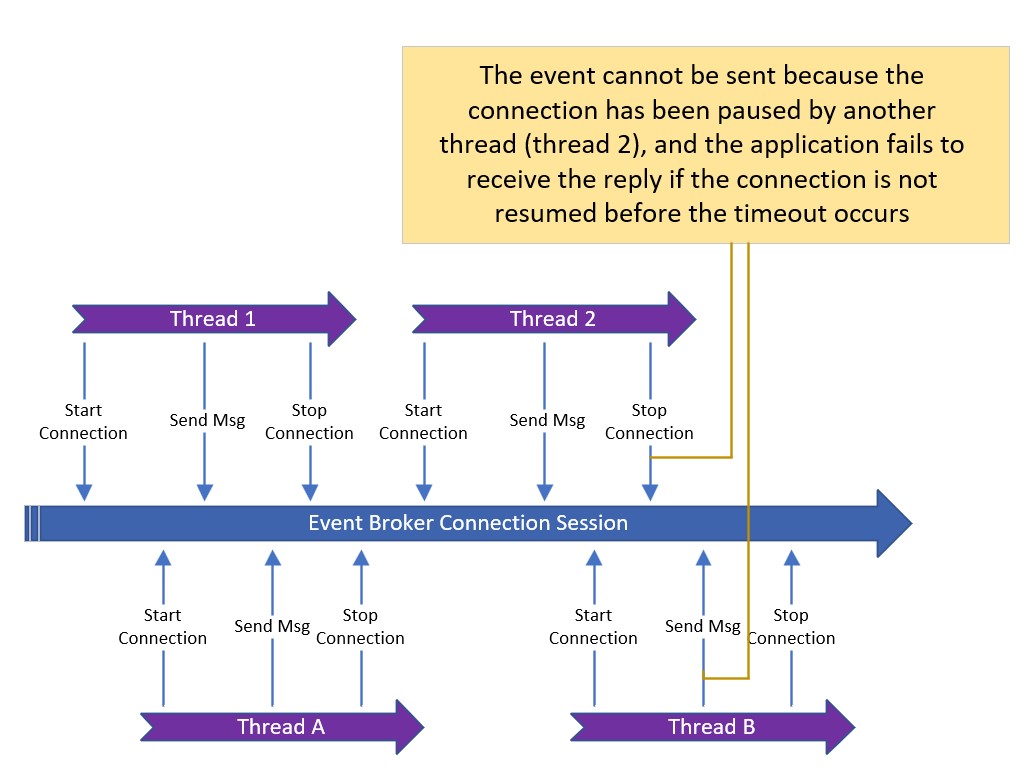
Connection Paused
The connection is paused by another thread while waiting for the reply event message.
Similar to the previous use case involving REST-style access, a separate thread is created to handle each new client request in this scenario. However, instead of creating a new connection for each thread, a pre-created persistent connection pool is utilized; and each thread attempts to control the connection by starting it, sending a event message, and stopping it.
Initially, this approach meets the requirements when the throughput is below 30 event messages per second. In this case, all requests effectively utilize the same connection, as shown by threads 1 and 2 in the diagram below. However, as the throughput increases to more than 50 events per second, the likelihood of overlapping usage for the same connection increases. This leads to decreased performance and an increased fail rate due to timeouts.
The solution to address this issue is quite simple. Just remove the logic to start and stop the connection for each thread and increase the number of current connections in the connection pool. By doing so, the performance and timeout issues caused by overlapping connections can be solved.
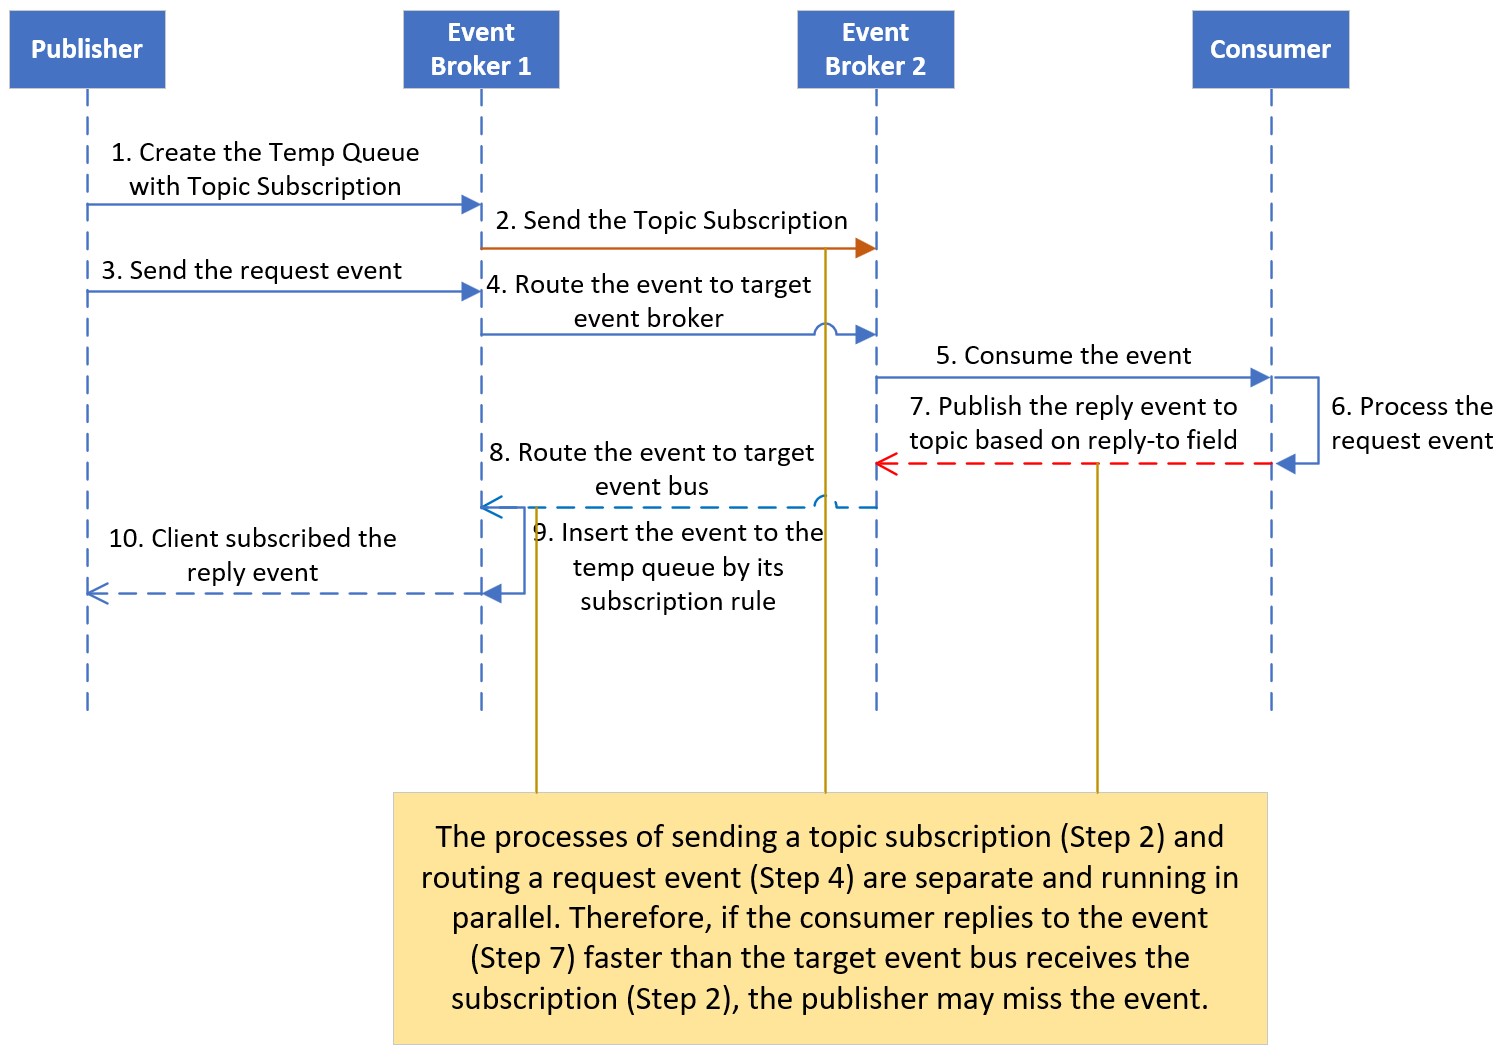
Premature Publication
The reply event message is published prior to the target event broker receiving the subscription request on DMR.
We have addressed two issues related to REST-style access, but there is still a small chance of missing an event when transferring it through dynamic message routing across the event mesh. REST-style access follows a stateless design, where multiple threads are created to handle different requests, and each thread needs to retrieve the corresponding reply from the source system.
To tackle this, the publisher initially creates a temporary queue to subscribe to the relevant topic, which includes specific thread instant information (e.g. the thread and instant id). Then, the request event message is sent to other event brokers by the publisher. However, these two actions (sending subscription request and request event message) go through separate communication channels across the event mesh.
As a result, there is a possibility that the source system receives the event message and publishes the reply event message faster than the target event broker receives the subscription request. Since DMR only routes the event message to the event broker that subscribes to it, the reply event message cannot be routed back to the source event broker. This is one of the reasons why using VPN bridging instead of DMR is preferred sometimes.
There are two ways to solve this issue depending on the application logic:
- Use a static VPN bridge to route the event
This solution suggests using a static VPN bridge to route the event to the corresponding source event broker, and the event can be directed to the appropriate destination. This approach can help ensure that events are properly routed and delivered to the desired location, including some unnecessary events which meet the routing condition. The bandwidth usage is larger than the DMR. - Create a Last Value Queue (LVQ)
This solution involves setting up an LVQ that subscribes to all reply event messages using wildcard patterns. This helps force the event message to be routed back to the corresponding event broker whatever there is an endpoint to subscribe it or not. By using the LVQ, you can ensure the reply event messages are directed back to the appropriate event broker for further processing or analysis.
Each of these solutions has its own advantages and considerations. It is important to evaluate the specific requirements and constraints of your application to determine the most suitable approach for addressing event routing and handling issues in your EDA design.
Filtered by APM
The event is filtered by a 3rd party APM library.
In order to enable end-to-end tracing, traditional Application Performance (APM) tools typically install an APM agent on the target server. This agent intercepts the communication between the application and client messaging library, inserting some additional fields (trace information) into the event message header on the publisher side. On the consumer side, the APM library extracts the trace information from these fields before processing the event from the client messaging library.
One issue we have encountered in the past is when the publisher’s APM agent inserts an invalid value into the event message header. As a result, the consumer’s APM library filters out this event from the event broker and automatically discards it, causing the event to be missed in the entire process.
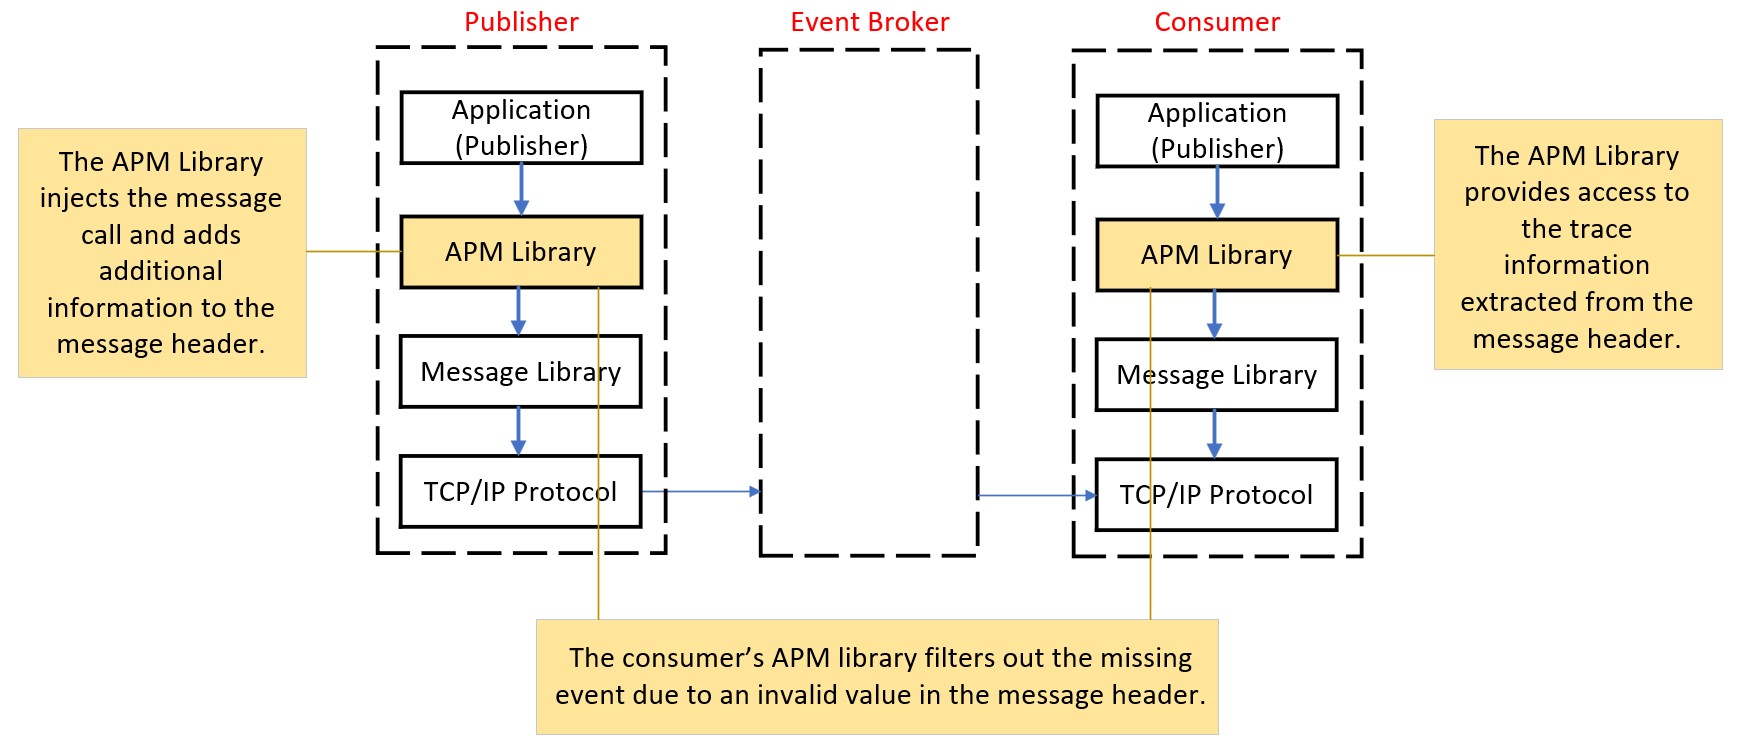
To troubleshoot this type of issue, you can use a well-tested program to subscribe to a specific topic. This ensures that the event is successfully received by the event broker. By comparing the event between the temporary queue and the consumer, you can identify the point at which the event is missed.
Unexpected Consumer
The event on the same queue is subscribed by an unexpected consumer.
This issue consistently occurs after a major release because outdated applications are still running and subscribing to events. As a result, these applications reject the request event message due to parameter errors. The outdated applications result from rolling upgrades across multiple sites and hundreds of instances. To adhere to tight release windows, these applications need to be upgraded in multiple phases and sites. Surprisingly, we have encountered this “ghost” process issue a few times on different systems in the last two months.
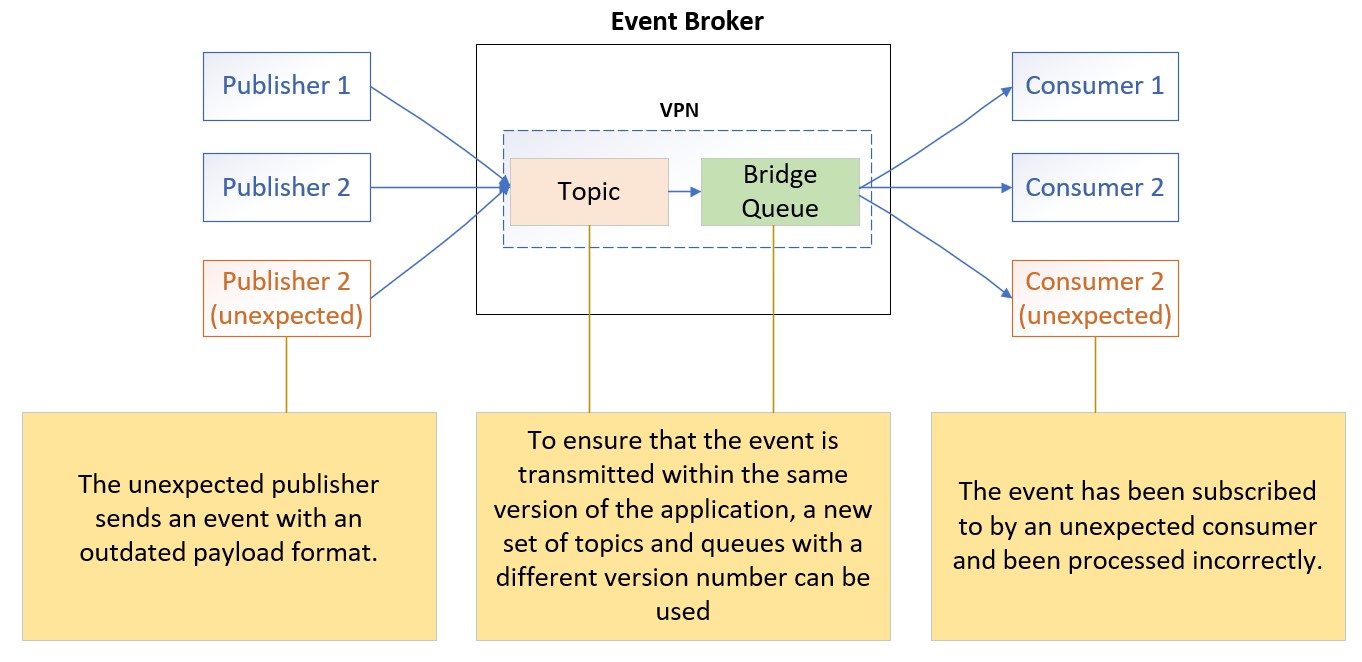
To resolve this error due to payload format change, simply change the version number on the topic and queue name in the new release. Then force the new application to publish events to the topic or subscribe from the new queues. Additionally, we recommend restarting the application after the upgrade to avoid any “ghost” processes lingering in the memory.
Non-Completed Receipt
The consumer is unable to complete the entire receiving process before a timeout occurs.
One case we previously encountered was when the consumer was running on a VM with two CPU cores and 2GB RAM, and subscribed to a 30MB event message from the event broker. After more than an hour, the consumer could still not successfully receive the event message. Before we explain the root cause of this issue, let us first take a look at the communication logic between the client messaging library and event broker.
The client messaging library uses a single context thread to handle the event message and heartbeat transmission riding on the persistent connection.
The client messaging library triggers the heartbeat message, and sends to the event broker every second the event broker connection is available. If the connection fails after 3 seconds and three retries (9 seconds in total), the library will terminate the connection and reconnect. Similarly, if the event broker does not receive the heartbeat and a timeout occurs, it will also disconnect the connection.
When the connection resumes, any pending unacknowledged event message will be redelivered to the client side. The client side will clean up the memory when it detects that the connection has been terminated, and will be ready to publish or subscribe to the new events.
The consumer in this case could not complete the whole subscription process due to the resource constraint, so it was caught in a loop. It would subscribe to the event, but before receiving the entire event, the connection would terminate, leading to a resubscription.
How to Quickly Identify Root Cause
The search for missing event messages is a complex and time-consuming process. While previous case analysis offers some insights for troubleshooting, daily operations often present more unusual cases. Even experts with extensive experience in messaging and applications may struggle to identify the root cause and require a significant amount of time due to multiple configurations and huge application logs. This can result in irreparable business losses.
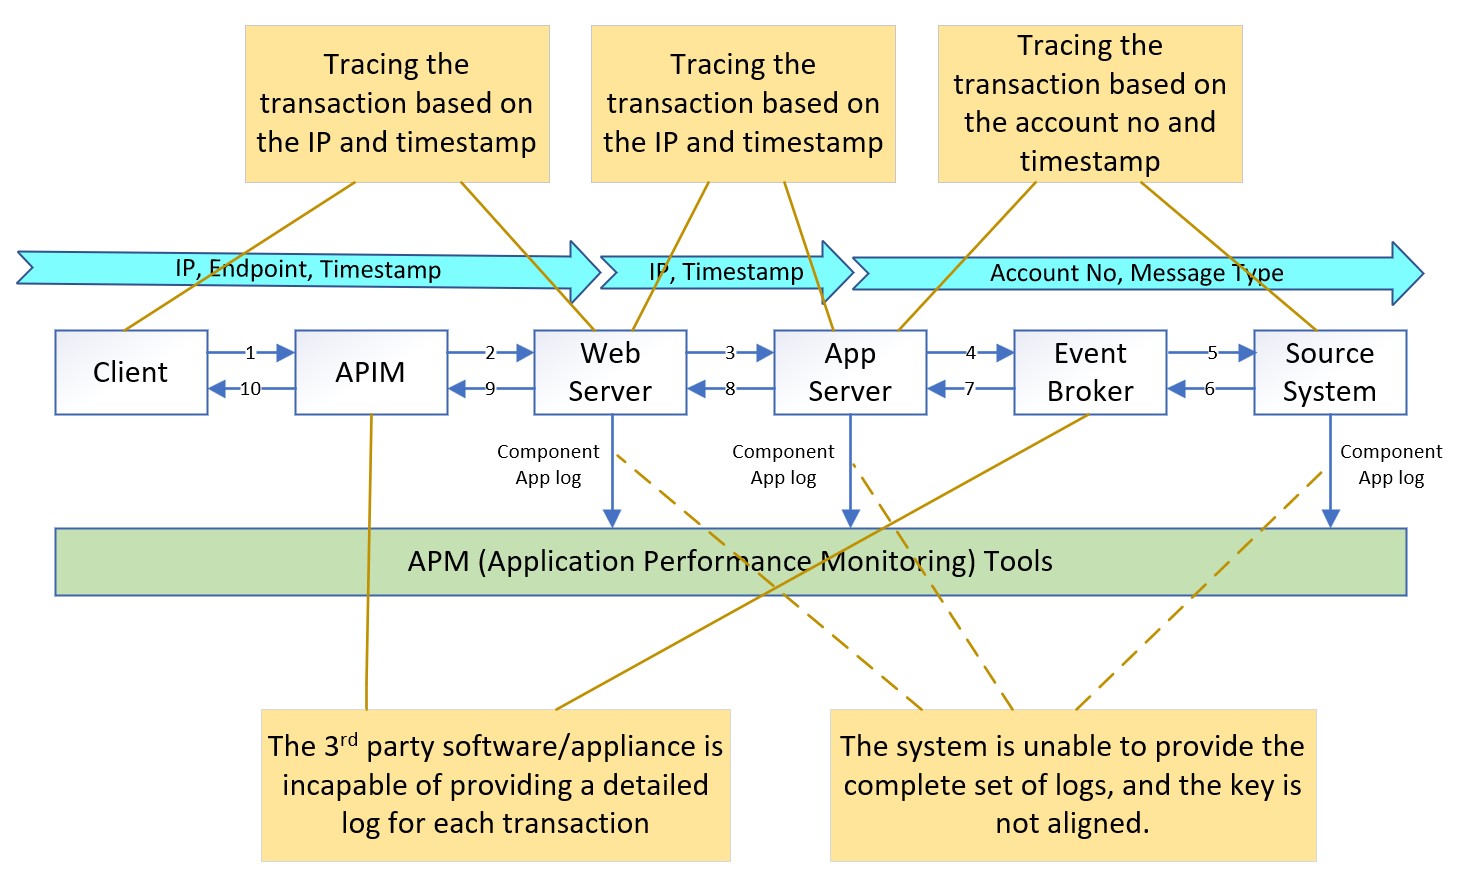
Additionally, modern enterprise architecture relies on a diverse ecosystem of specialized third-party products and appliances to create a reliable, stable, scalable, secure, and high-throughput application platform. Since events can occur anywhere within this architecture, it becomes necessary to have a distributed tracing solution that can help narrow down the scope of troubleshooting area.
Previous case analysis was based on traditional monitoring solution, where applications and the event broker generate logs that are typically stored in event logs or log files as needed. Application Performance Monitoring (APM) tools use specific agents to collect these logs, allowing developers to correlate relevant log records and visualize data analysis. However, log information is often dependent on upstream system data and application logic leading to inconsistency in the keys used across different endpoints.
OpenTelemetry (OTel) is an open industry standard to collect uniform telemetry data across distributed applications, and consists of three key components: Trace, Log, and Metric. Gartner has identified it as one of the key emerging technologies that optimize technological delivery in 2022. Furthermore, all leading APM tools such as Datadog, Dynatrace, New Relic, Splunk, and Honeycomb [referencing Gartner’s 2023 Magic Quadrant for Application Performance Monitoring and Observability] have announced their support for OTel.
OTel’s Trace component and Log component collaborate seamlessly through unique identifiers like trace ID and span ID. These unique identifiers enable correlation, allowing users to link trace data alongside corresponding log entries for comprehensive analysis and troubleshooting.
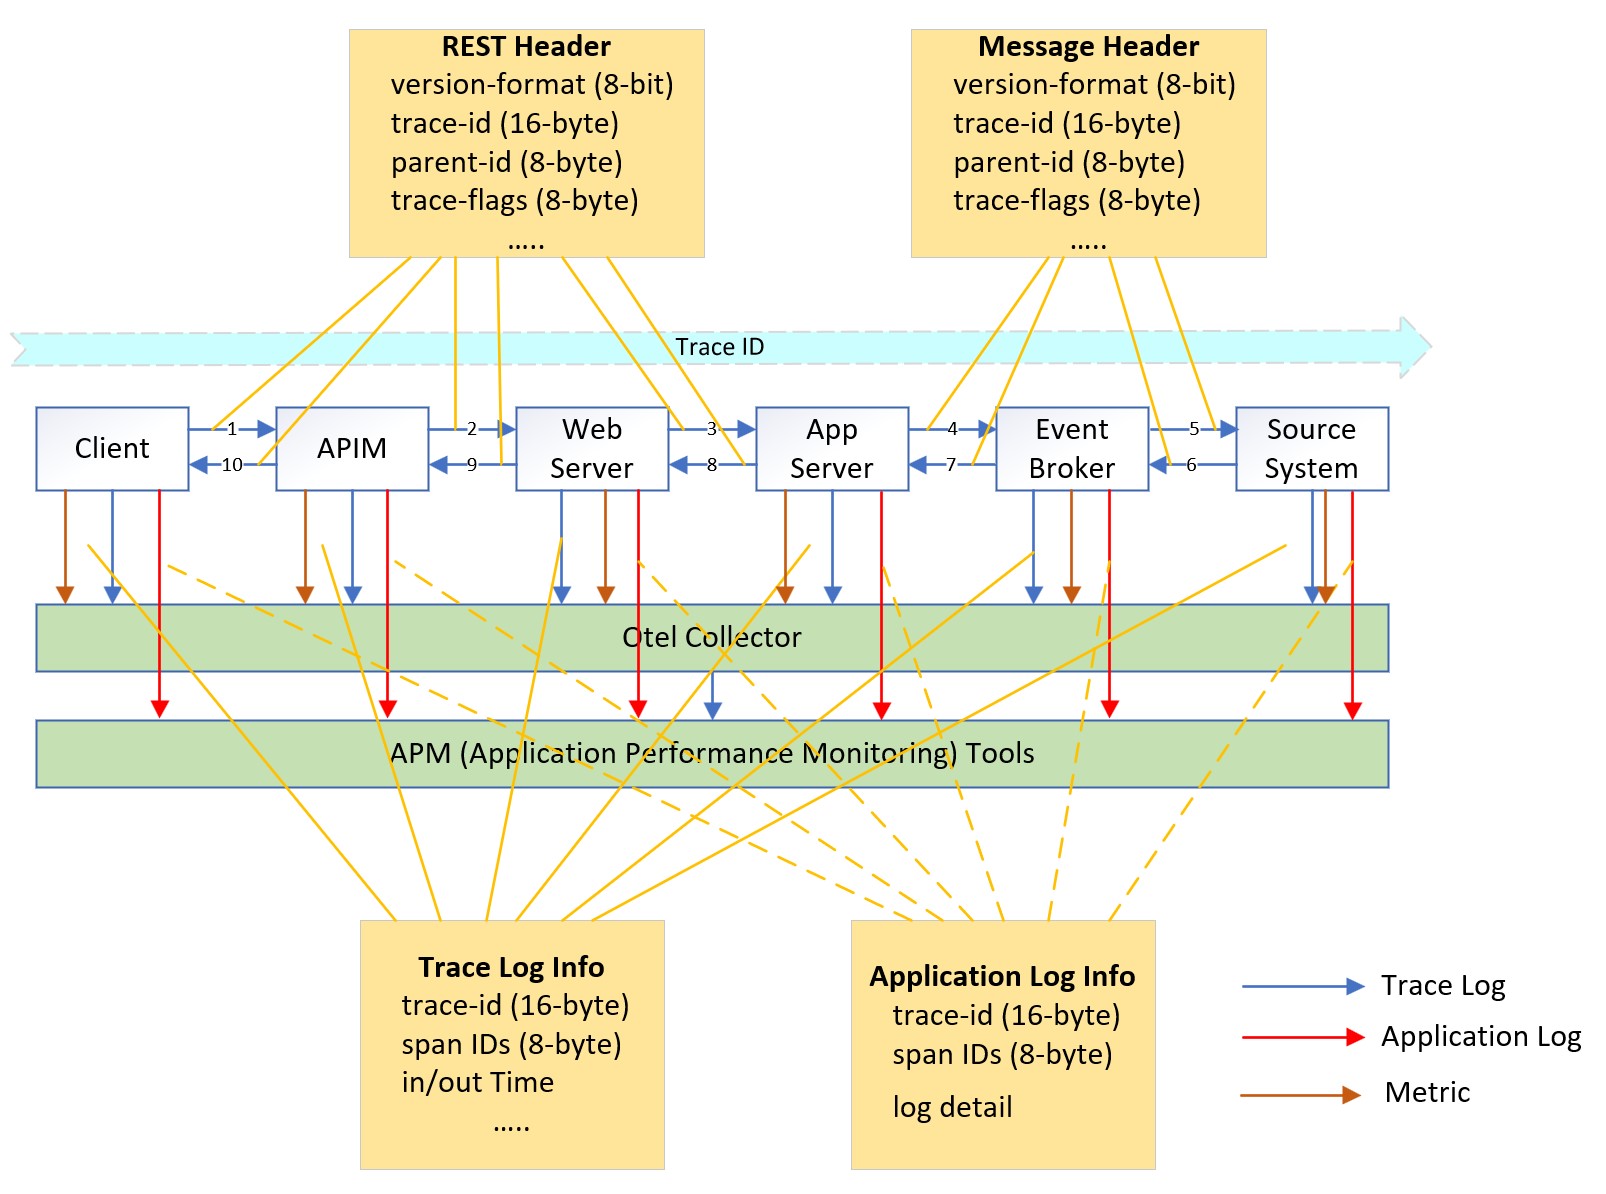
Currently, OTel supports 11 programming languages, and a diverse range of protocols for capturing data and enabling comprehensive observability within an application’s ecosystem. For example, it supports HTTP and gRPC. The draft version of MQTT has been tailored for OTel, although the official support date is to be confirmed.
Most event broker and event streaming products such as Kafka, Solace, RabbitMQ have embraced OTel. By leveraging OTel, it becomes easier to identify missing events within the trace workflow, allowing for better visibility and understanding of the event flow.
The article “Building an OpenTelemetry Distributed Tracing Solution” provides more detailed information on OTel and its capabilities.
Summary
No matter how well-defined your organization’s best practices are and how diligently they are enforced through the governance process, it is impossible to completely avoid missing event messages. However, it is crucial to promptly identify the issue and recover the system within a short period to minimize impact on the business. In this article, we have dedicated a significant section to explaining the basic concept of message protocol. Additionally, this article analysed common mistakes through several production incidents. While it may not cover all possible incidents, our intention is to provide you with a starting point for troubleshooting missing events.
The post Needle in a Haystack: Finding Missing Events on an Event Mesh appeared first on Solace.